
How to Build a Simple Data Logging System
From a sensor to a clean CSV (and a live chart) — the practical components, the choices that matter, and how to avoid the mistakes that ruin a dataset.
Whether you're tracking a fridge's temperature overnight, capturing a motor's current under load, or validating a prototype over a week, the need is the same: measure something repeatedly and save it with timestamps. That's a data logging system. The good news is you can build a solid one from a handful of off-the-shelf parts. Here's how to think it through.
The five parts of any data logger
Every logging system, simple or complex, has the same building blocks:
- Sensor — turns a physical quantity (temperature, voltage, force) into an electrical signal.
- Acquisition device — a DAQ or smart interface that digitizes the signal.
- Host / controller — a PC, an SBC, or onboard logic that reads the device.
- Software — reads values on a schedule and writes them somewhere.
- Storage + visualization — a CSV/database, and a chart to actually see the data.
Get those five right and you have a logger. Most projects fail not on the sensor but on the choices around it — sample rate, timestamps and reliability. We'll cover those.
Step 1 — Define what you're logging (before buying anything)
Write down, for each signal:
- What it is and its range (e.g., 0–80 °C).
- The smallest change you need to capture (this sets resolution).
- How often it changes (this sets sample rate).
- How long the test runs (this sets storage and reliability needs).
This one paragraph prevents most wasted purchases. Logging temperature once a second for a week needs very different hardware from capturing a current spike at 10 kHz.
Step 2 — Choose the acquisition device
Two clean paths, both stocked locally:
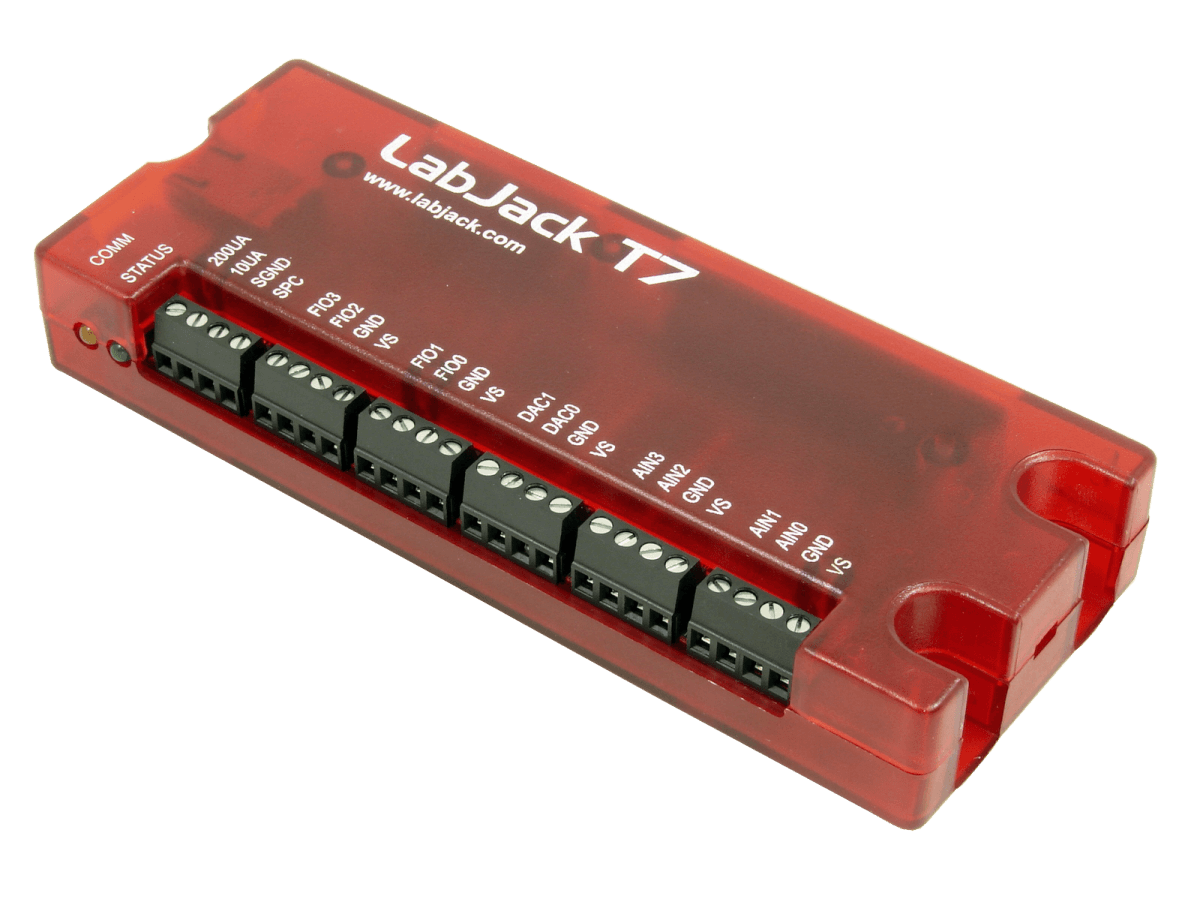
- Multifunction DAQ (LabJack): ideal when you have analog signals and want measurement quality. A LabJack T7-Pro is a strong choice because it can also log autonomously — its onboard Lua scripting and memory let it record data even without a PC connected, which is gold for unattended or field tests. Browse the DAQ collection to compare.
- Phidgets VINT: ideal when you want plug-in modules in engineering units (a temperature interface, a humidity sensor, a current sensor) and a host PC or an SBC4 to log them. Less raw analog horsepower, far less wiring.
Step 3 — Choose the host
- A PC/laptop is simplest for bench work — you already have it, and you can chart live.
- An SBC (e.g., PhidgetSBC4) or the T7-Pro's onboard logging is better for unattended, long-running, or remote logging where you don't want a laptop tied up for a week.
- For networked setups, an Ethernet/WiFi device can log to a central machine.
Step 4 — Write (or configure) the logging software
The logging loop is short and always the same shape:
- Open the device/channel.
- Set the sample interval (e.g., one reading per second).
- On each reading, grab the value and a timestamp.
- Append a row to a CSV (or insert into a database).
- Optionally, update a live plot.
Python is the most common choice — a few lines with the Phidgets or LabJack library plus the built-in csv module gets you a working logger. Prefer no-code? Tools like LabJack's logging utilities or DAQFactory can log without programming. The T7-Pro can even be configured to log on its own and you just collect the file later.
Step 5 — Get timestamps and reliability right
This is where amateur loggers fall apart:
- Timestamp every sample at the moment of reading, ideally from a reliable clock. Without good timestamps your data is hard to align or interpret.
- Flush/append to disk regularly so a crash doesn't lose hours of data — don't hold everything in memory until the end.
- Handle disconnects — wrap reads so a brief USB hiccup pauses rather than crashes the run.
- Watch file size for long, fast logs; rotate files (one per hour/day) for week-long captures.
- Note your units and metadata (sensor type, range, location) in a header row or sidecar file — future-you will thank you.
Step 6 — Store and visualize
A timestamped CSV is perfect for most projects — it opens in Excel, Python (pandas) or any plotting tool. For long-running or multi-source logging, a lightweight database (SQLite, InfluxDB) scales better. For live monitoring, plot as you log so you catch problems while the test is still running, not after.
A concrete example: overnight temperature log
- Signal: 0–80 °C, need 0.5 °C resolution, changes slowly, runs 12 hours.
- Device: a temperature interface on a VINT Hub, or a thermocouple/RTD on a DAQ.
- Host: a laptop (or SBC4 if the laptop's needed elsewhere).
-
Software: Python loop, one sample every 5 seconds, append
timestamp, temperature_Cto a CSV. - Reliability: flush every 10 rows, wrap reads in a retry.
- Result: ~8,600 clean, timestamped rows you can chart in seconds.
That's a genuinely useful logger built from stock parts in an afternoon.
Common pitfalls (quick checklist)
- Sampling far faster than needed → huge files, no benefit.
- Sampling too slow → you miss the event you cared about.
- No timestamps, or unreliable ones.
- Buffering everything in RAM until a crash wipes it.
- Wrong sensor type for the temperature/force range.
- No live view, so a wiring fault ruins the whole run unnoticed.
Wrap-up
A data logging system is just five parts wired around one short loop. Spend your effort before you buy — defining each signal's range, resolution, rate and duration — then pick a DAQ or VINT setup to match, and get timestamps and reliability right. Do that and you'll end every test with data you can trust.
Want a logger that just works?
Tell us what you're measuring and for how long, and we'll spec the device, sensor and accessories — and point you to the simplest logging path, code or no-code. Local stock, genuine products, fast delivery.
Plan your logger with us →